fluxWiki - The wiki for luxflux.software
First Steps
Welcome to hyperspectral imaging!
Discover the invisible with fluxTrainer
You have bought our software or downloaded our demo software, in the following you will find some general information on how to get started.
How to install our software?
Please notice if you want to use our software you need a license key from us.
If you are uncertain about buying our products, feel free to check out our FluxTrainer-Demo-Version for Windows. You will find a download on our website under Downloads and you can get a demo license key on request (info@luxflux.de).
Double-click on both files and the program will automatically install.
Currently, the demo is only available for Windows 7/10 (Mac and Linux on request).
If you have questions please email info@luxflux.de.
First time opening our software program: Where do I find which application?
[Structure Overview]
Start Screen
When opening "fluxTrainer Demo" the following start screen shows up:
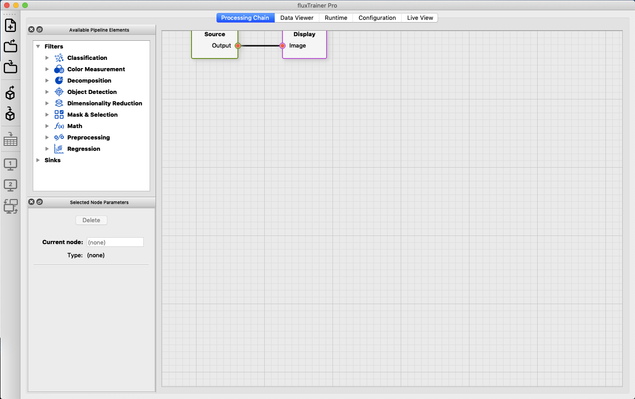
In the Processing Chain tab, you can build the workflow for your data. It consists of a Node Shop widget with our available pipeline elements, a Node Parameters widget displaying the node parameters, and a Node Graph widget in which you can create your processing model consisting of nodes.
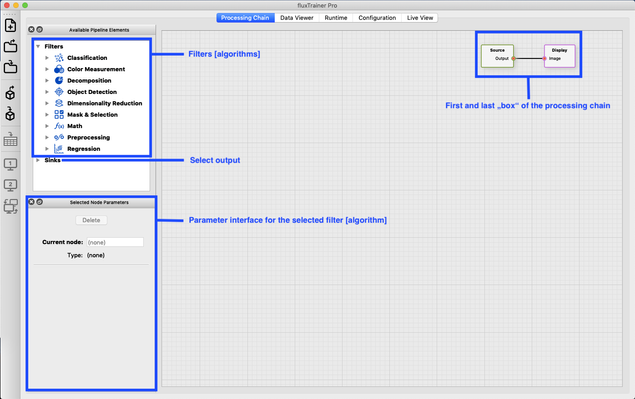
Available Pipeline Elements:
Icons in the left column:
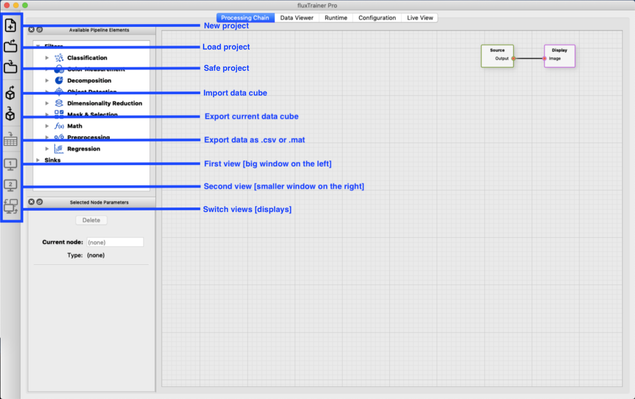
Upload the data
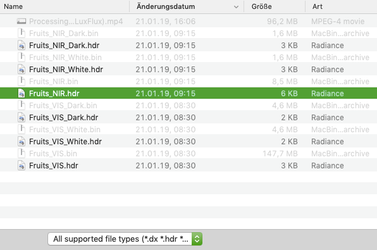
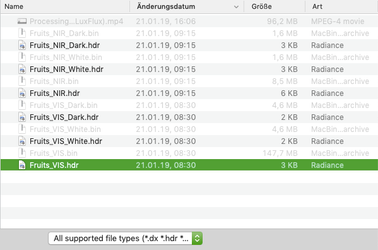
Before you import the data cubes (files in .hdr and .bin format needed), check if your file has all the following data information in it:
- ENVI_Cube.hdr
- ENVI_Cube.bin
- White_Reference.hdr
- White_Reference.bin
- Dark_Reference.hdr
- Dark_Reference.bin
![]() If your dataset is complete, load the ENVI_Cube.hdr to the software.
If your dataset is complete, load the ENVI_Cube.hdr to the software.
If you want to load two different cubes (NIR and VIS), like in the following picture, you need all the references (data information) of both cubes. You can only load them one after another (not simultaneously):
If you already uploaded some cubes following window will pop up (this case doesn't happen when you upload your first cube).
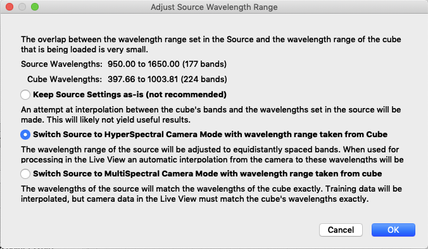
You will be asked which wavelength range you want to choose. The default source parameters are set to start at 950 nm and range to 1650 nm with an increment of 4 nm.
After uploading a second cube there could pop up another window:
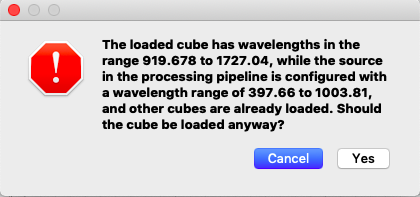
This window informs you about the different wavelength ranges of your two cubes. Click yes to complete the import of the second cube.
You can configure the wavelength range later (→ see next chapter: data viewer).
How to build a model
Setting up a processing chain
As shown before, you find all the available algorithmic elements listed on the upper left. Select now a pipeline element you want to include into your processing chain and add it to the big window on the right via drag-and-drop.
Sample: Tablet Inspection
The following screen shows a processing chain to distinguish mints with and without sugar.
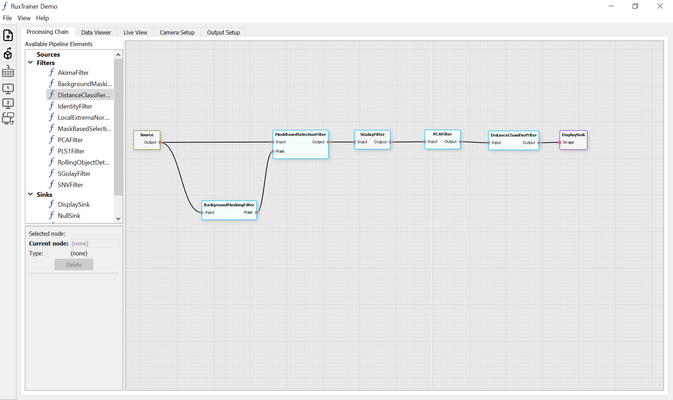
The processing chain defines which filters (algorithms) are executed and when.
Filter details you can find here.
How to show the results on the screen
The Data Viewer
After loading the data cubes click on the second tab "Data Viewer" in the tab bar.
In this step you are training your model with hyperspectral data cubes.
Widgets are used to display and edit the data.
Widgets and Parameters of the Data Viewer.

| 1 View | Menu button to select or deselect shown widgets ('Loaded Data', 'Secondary View', 'Group Assignments', 'All Groups', 'Cube Settings', 'Parameters'). |
2 Export table data | Export table data as .csv or .mat . A window will pop up where selection of the wanted data can be done. |
3 Display switch | Switches display between 'Primary' and 'Secondary View'. |
4 Select display | Select which training step is shown as primary view. Done either by clicking on the 'Select view' button, in the center of the 'Primary View' widget, or by clicking on the 'Change Primary View' button on the left. |
5 Export data cube | Export a selected cube either with the 'Export cube' button or by using the 'Export Current Cube' on the side toolbar. |
6 Remove data cube | Removes a selected cube from the training process. |
7 Select display | Like 4 but for 'Secondary View'. |
8 Parameters | Change parameters from the source, filters or algorithms. To do so left-click on a training step (node) and select 'Edit parameters...'. |
| 15 Load image series | Load a Portable Network Graphics (.png) series with the following name convention: "Name"+"_"+"Wavelength"+"_"+"Frame Number"+".png", e.g. TestImage_632_5.png. You can provide several frames corresponding to one wavelength which are then averaged. The image series is transformed into a data cube that you can process in the fluxTrainer and export with the ENVI-format. |
You uploaded two data cubes with different wavelengths? Here is what to do:
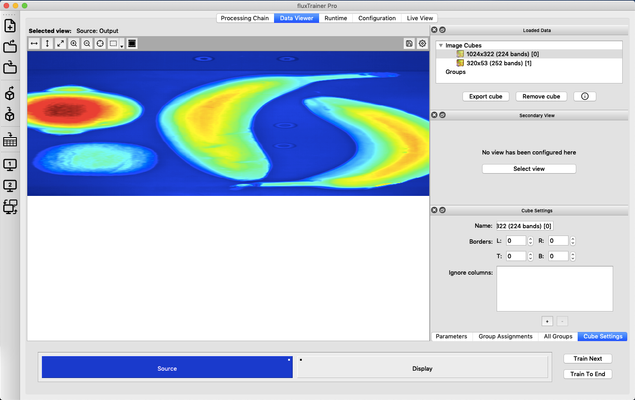
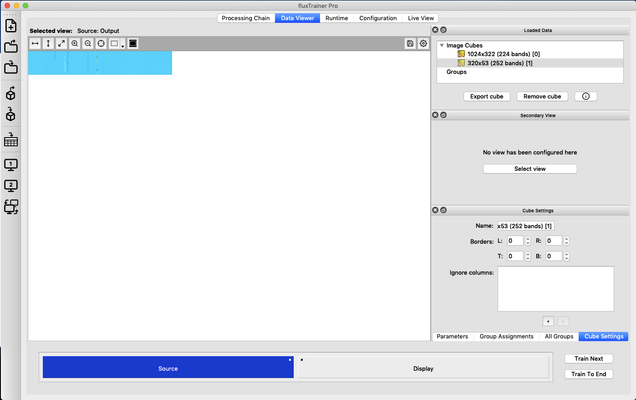
First, you will notice a problem, that one of the two images isn't shown right. In the following example we uploaded an VIS and an NIR cube.
As you see, VIS (~400-1000 nm) and NIR (~1000-1600 nm) have a different wavelength (nm) scale.
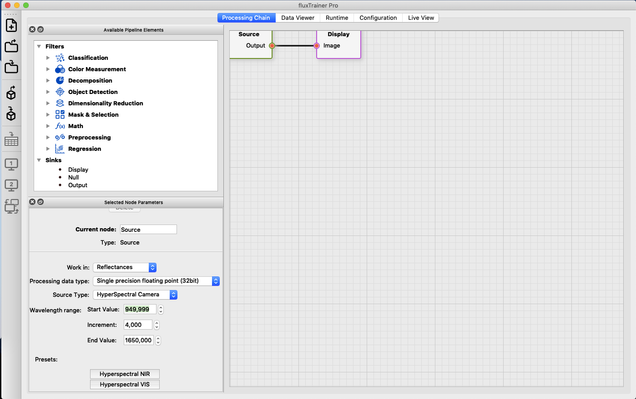
Btw. when you look at the Selected Node Parameter window after clicking on the tab Processing Chain, you notice that our selected scale for NIR goes from 950-1650 nm and for VIS it is 400-800 nm.
On the left your screen is showing the wanted result. The uploaded image on the right Screen, on the contrary, doesn't reveal anything useful so far.
In order to show the wanted picture on the right, you need to change the range of the wavelengths. To do so, go back to the Processing Chain tab, click on Source and take a look at the window Selected Node Parameters on the left. You can change the scale manually or you can choose between Hyperspectral NIR and Hyperspectral VIR or, last but not least, you can take the wavelength scale directly from the loaded data by clicking on the button called Loaded Cube.
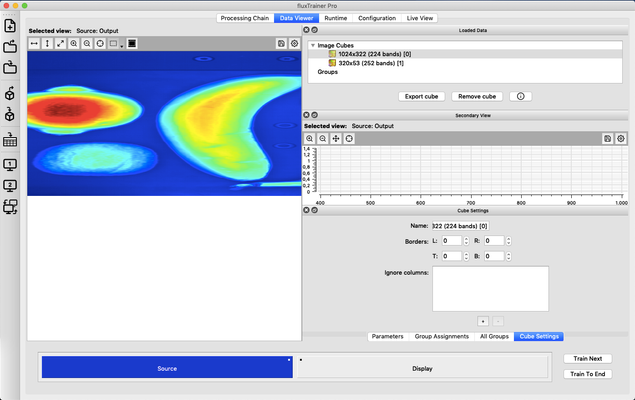
How to show another visualization on the secondary view window
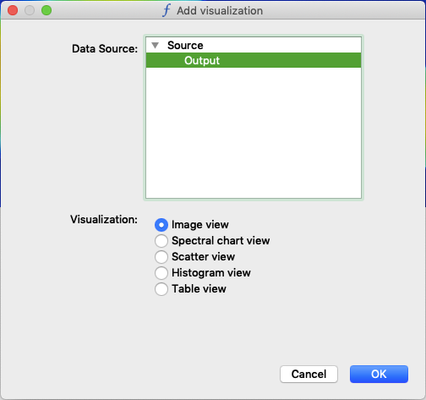
Click on Select view to create a new visualization.

Following window opens now (see on the screenshot below). Select a visualization mode (e.g. spectral chart view to show a spectrum).
After selecting spectral chart view, following picture shows up:
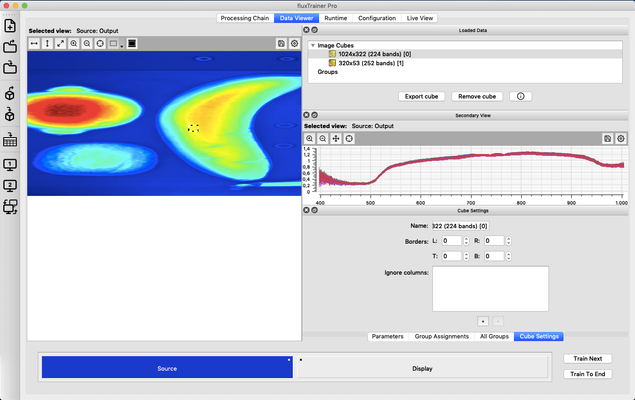
How to select a specific detail of the image
In order to select a specific range of pixels, you can click on following button: 
Click on the image now and draw a square on the detail you want to take a closer look at.
fluxWiki - The wiki for luxflux.software